Business Intelligence Dashboard
An interactive analytics platform designed to transform operational data into clear dashboards, reports and actionable business insights.
Project Overview
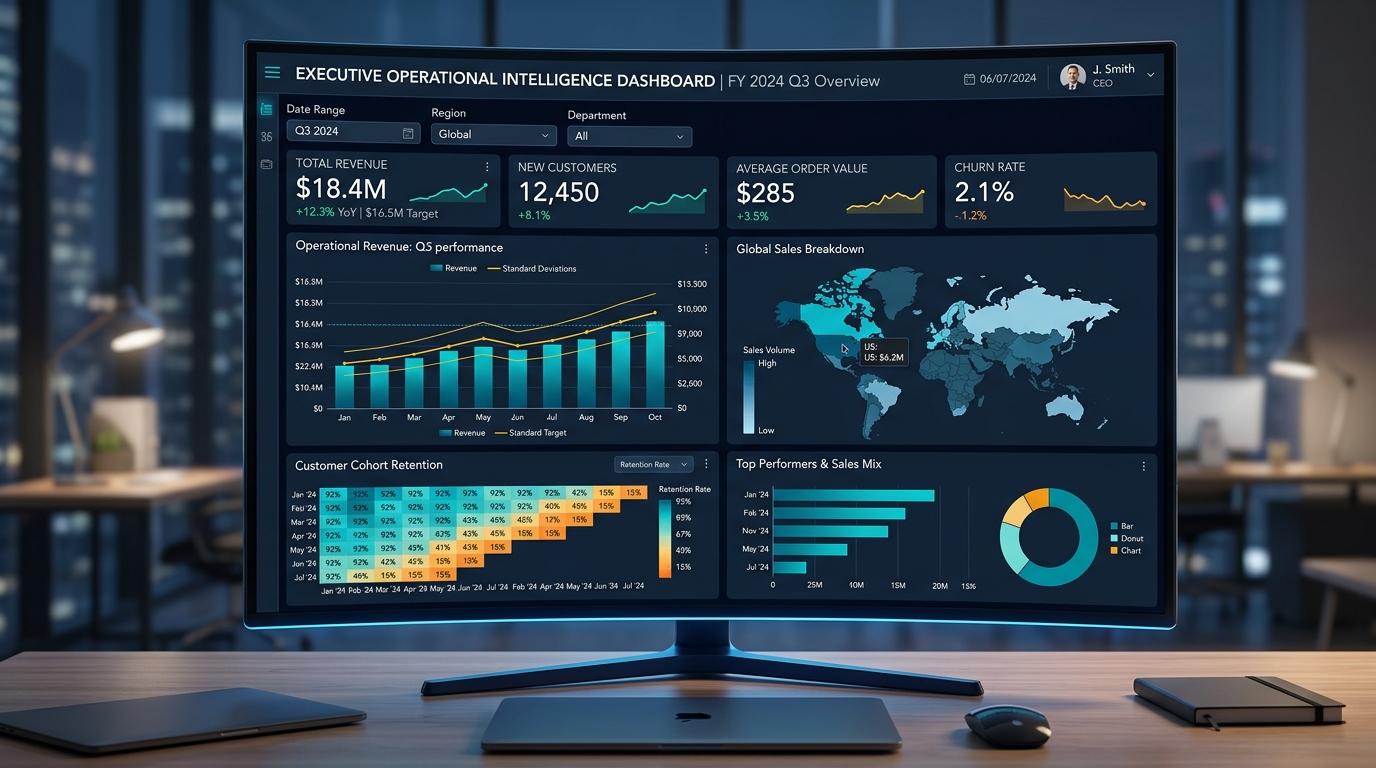
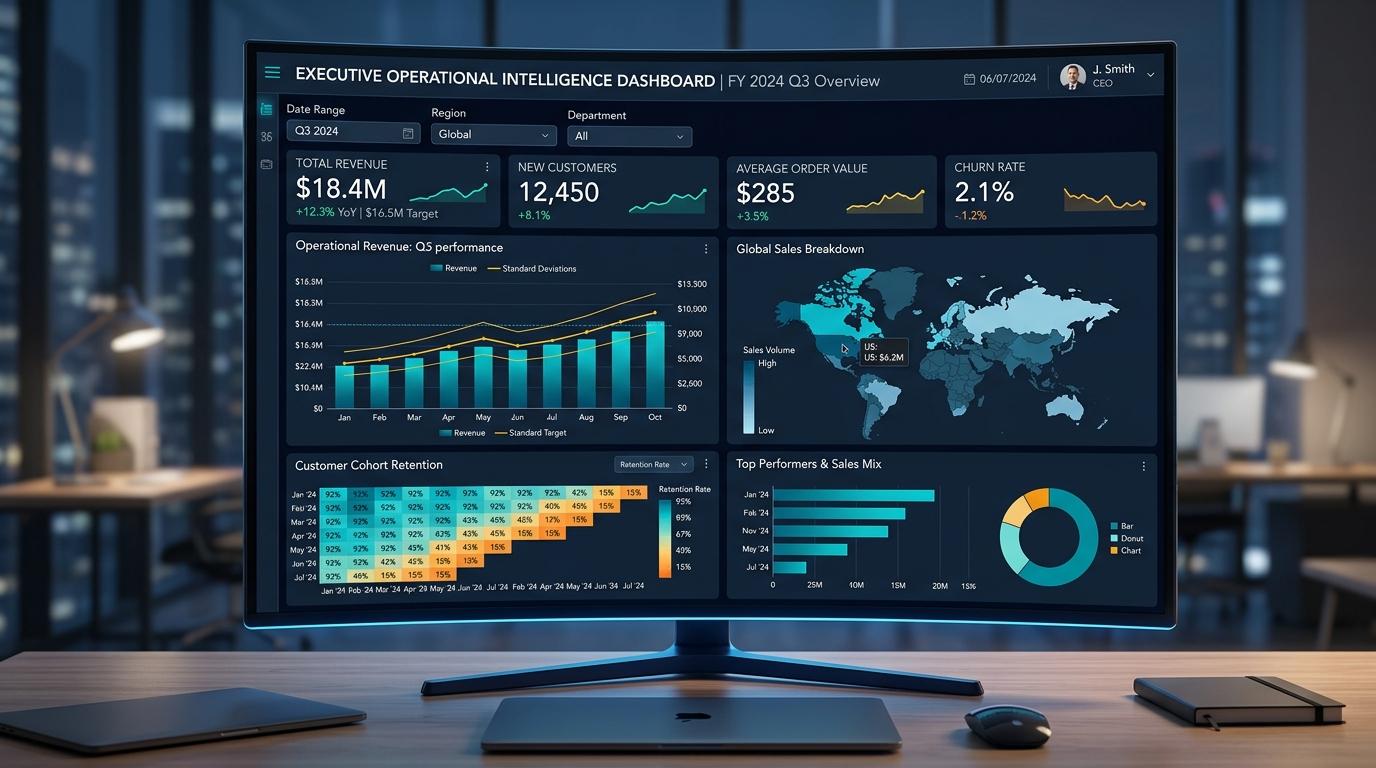
AiTechGrow architected a responsive Business Intelligence platform that consolidates fragmented enterprise data streams into executive dashboards. Featuring real-time KPI scorecards, regional revenue heatmaps, customer cohort retention graphs, and predictive forecasting, it empowers leadership with actionable decision intelligence.
Full-cycle product architecture, UI/UX design system engineering, backend service integration, and automated cloud delivery.
The Challenge
Prior to implementation, the client faced systemic operational, design, and scalability hurdles that required a ground-up technical solution.
Disparate Siloed Data Sources
Critical business metrics were scattered across separate CRM, ERP, and payment databases with no single source of truth.
Slow Month-End Reporting Cycles
Finance and operations spent days manually merging CSV files to produce monthly executive performance decks.
Inability to Drill Down into Root Causes
Static reports showed revenue dips without the ability to filter by department, geography, or customer cohort.
Poor UI Accessibility on Mobile & Tablets
Executives traveling lacked a clean, secure interface to review key performance indicators on the go.
Our Approach
A disciplined six-phase execution lifecycle moving systematically from initial requirements discovery through to production deployment.
Discovery
Audit data warehouse schemas, reporting needs, and executive KPI definitions.
Strategy
Design an optimized data aggregation layer for sub-second dashboard rendering.
UX/UI
Craft dark-navy UI with high-contrast data visualization palettes and crisp chart typography.
Development
Build interactive React dashboard with Node.js aggregation pipelines and MongoDB.
Testing
Validate numerical calculations against financial ledgers and conduct load tests.
Deployment
Deploy with role-based dashboard access and automated data cache invalidation.
Designed Around the User
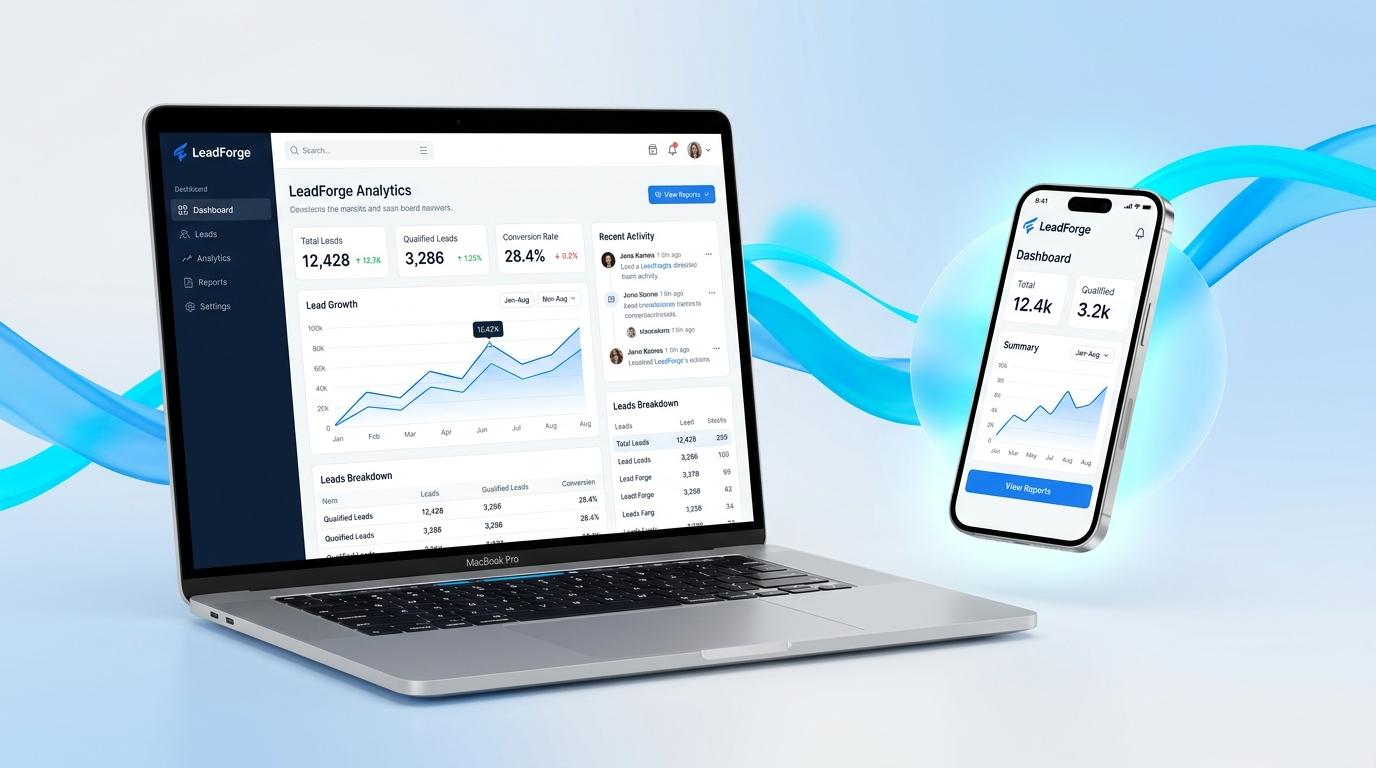
Every screen was purposefully crafted to prioritize content hierarchy, responsive fidelity, and frictionless user interaction across viewport sizes.
Responsive & Accessible
Engineered with fluid typography tokens, high color-contrast ratios, semantic HTML landmarks, and zero layout shift across devices.
Key Features Delivered
The core functional systems and interactive capabilities delivered into production for this application.
Real-Time KPI Scorecards
Instant visibility into total revenue, active customers, average order value, and churn rate.
Cohort Retention Heatmaps
Visual cohort analysis tracking customer retention and lifetime value across monthly signups.
Interactive Global Map
Geographic sales breakdown with drill-down capability into regional performance.
Operational Variance Charts
Tracking performance against budget targets with standard deviation bounds.
Custom Date Range Slicing
Fast filtering by fiscal quarter, year-to-date, month, or custom date spans.
Automated Report Export
One-click generation of PDF executive summaries and raw data CSV downloads.
Technology Stack
Chosen for maintainability, high concurrency performance, strict type safety, and seamless cloud scale.
Project Outcomes
Factual engineering milestones and deliverables verified upon production handover.
Project Gallery
Click any screenshot to expand in high-definition lightbox view

Have a project in mind?
Have an idea, a business challenge or a product that needs to be built? Let's create something meaningful together.